< Mini-apps
Warwick Memory Tools - Suite of tools for parallel application memory consumption analysis
WMTools
Written as a PhD project by Oliver Perks at the University of Warwick. WMTools is a suite of applications designed to assist with the profiling and subsequent analysis of memory consumption data for parallel applications.
Even at large scale many applications still stuggle with excessive memory consumption. This project aims to provide the necessasary tools to analyse the memory usage and help identify memory problems.
The project consists of a shard library for tracing the application in question, and a set of applications to analyse the resulting output. The tracing library is designed for MPI applications based on standard POSIX memory management (C, C++ and Fortran), and requires no application recompilation.
Currently there is no support for hybrid languages, or accelerators, but it is an active area of research and development, and we hope to release a new version with support in the near future.
For any other feature requests, please submit an issue.
WMTrace
WMTrace is the data collector for the tool suite. It attaches to an application on load, and quietly collects data about the memory management. Data collected during this phase is streamed to file, in a compressed binary format.
The performance impact of the tracer is application dependant. The volume of memory management calls, coupled with the depth of call stacks will impact on the slowdown, and volume of data generated.
WMAnalysis
WMAnalysis is the base analysis class, providing information on total memory consumption High Water Mark (HWM).
Due to the parallel nature of the execution environment the tool also reports HWM variation, in the form of Max, Min and Standard Deviation of the HWM of each process in the job.
WMAnalysis is also the basis for some deeper analysis, including temporal and functional breakdowns. The tools is able to output memory consumption over time, for each process, in the form of a GNUPlot graph script. It can also produce a list of memory allocations grouped by call site location, and ordered by size, helping to identify the largest consuming functions.
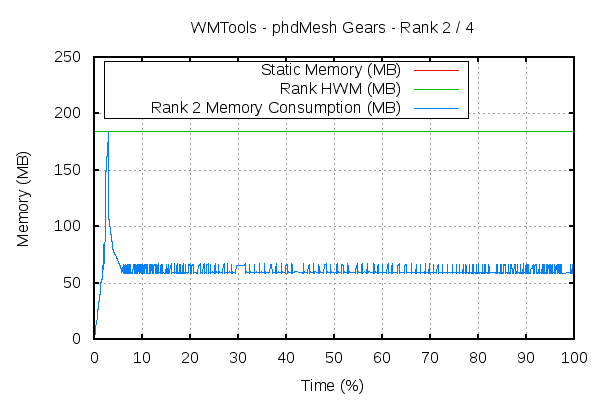
The image above demonstrates the memory consumption profile of rank 2, as part of a 4 core execution of phdMesh.
WMModel
WMModel is an experimental analysis feature. By analysing multiple HWM trace files, the tool identifies patterns in memory consumption. This is done by looking at the trend between allocation size within the same call stack location. By relating the growth of allocation size related to the problem size and core count the tool produces a generalised formula to predict HWM at different problem scale.
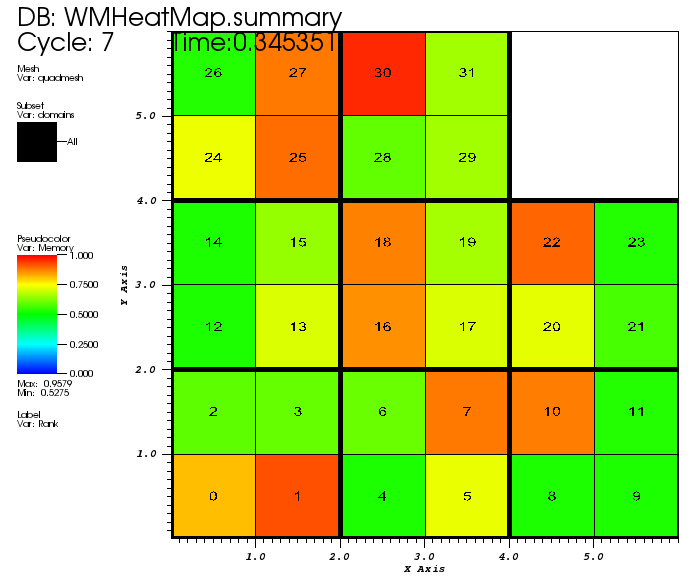
WMHeatMap
WMHeatMap is another means of data visualisation. The tool produces a VisIt output (in Silo format) mapping consumption over time for all processors in the job grouped by rank. The data is sampled from the complete temporal trace, and highlights any imbalance between the memory consumption between processes.
Publications
Perks, O.F.J. and Beckingsale, D.A. and Hammond, S.D. and Miller, I. and Herdman, J.A. and Vadgama, A. and Bhalerao, A.H. and He, L. and Jarvis, S.A. (2012) Towards Automated Memory Model Generation Via Event Tracing. The Computer Journal. ISSN 0010-4620
Perks, O.F.J. and Hammond, S.D. and Pennycook, S.J. and Jarvis, S.A. (2011) WMTools - Assessing Parallel Application Memory Utilisation at Scale. Computer Performance Engineering. Lecture Notes in Computer Science, 6977. pp. 148-162.
Perks, O.F.J. and Hammond, S.D. and Pennycook, S.J. and Jarvis, S.A. (2011) WMTrace - A Lightweight Memory Allocation Tracker and Analysis Framework. In: Proceedings of the UK Performance Engineering Workshop (UKPEW'11), 7-8th July, 2011, Bradford, United Kingdom.